By The Chiri Team
What does an hour of a team’s work actually cost once an agent is doing it? Most finance leaders can name the price of a token. Few can name the price of a finished task. That gap is turning into the most expensive blind spot in enterprise AI spend.
Every model vendor points to falling per-token prices as proof that AI is getting cheaper. New evidence says the opposite is happening to the bill. Prices per token are falling. Total spend is rising anyway, because usage grows faster than price falls. The real control point for a business is not the price of a token. It is the cost of a completed unit of work, and almost no company manages to that number on purpose.
Three data sources appeared within days of each other in August 2026. Each describes the same underlying pattern from a different angle. One measures the economics of the price cut itself. One measures how the cut lands on an engineering team. One measures which businesses already manage spend against a return, and which do not.
The price falls. The bill still rises.
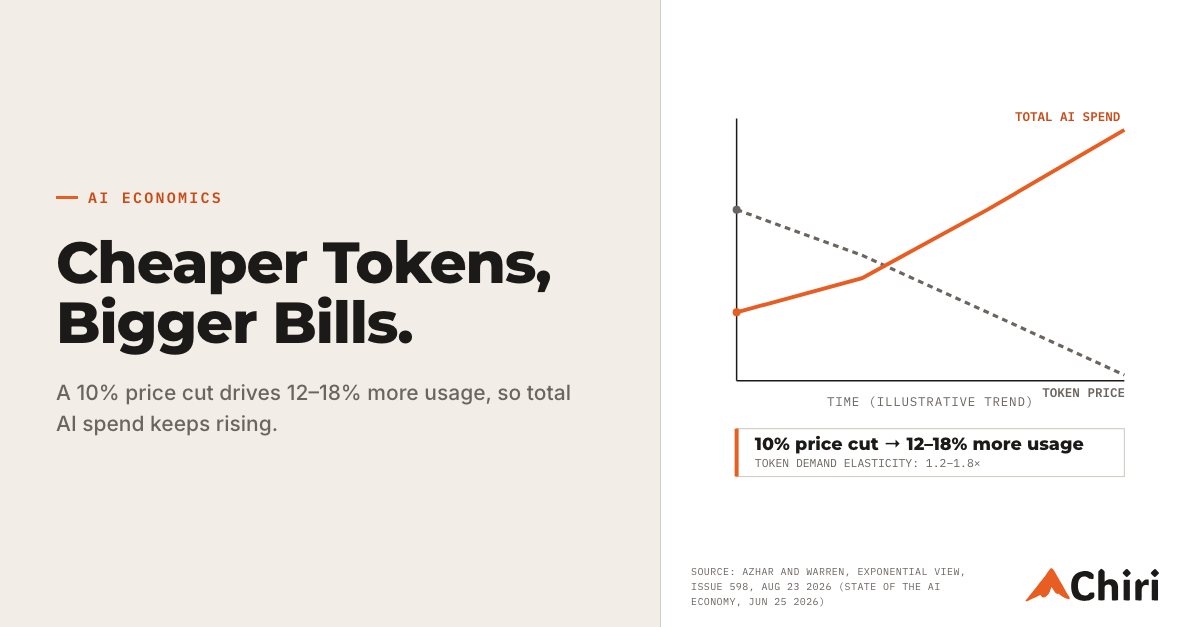
Exponential View issue 598 appeared on August 23, 2026, written by Azeem Azhar and Nathan Warren. It puts a number on a pattern many finance teams have felt without measuring it. The issue draws on the authors’ State of the AI Economy report from June 25, 2026. Token demand elasticity runs at roughly 1.2 to 1.8. Every 10% cut in the price of a token produces 12% to 18% more tokens used.
That elasticity number is the whole mechanism in one line. A price cut does not shrink a company’s AI bill. It removes the reason to ration usage. Usage then expands faster than the unit price drops. Total spend climbs even as every vendor announcement claims prices are falling.
This is not a one-time adjustment that settles once teams get used to cheaper access. Elasticity above 1.0 means the relationship compounds with every price cut a vendor makes. A model provider cuts price to win market share. That same cut hands its customers a reason to run more jobs through the model. Both effects land on the same invoice. Most companies read only the price line, and miss the usage line moving faster underneath it.
A finance team may budget AI spend by extrapolating last quarter’s per-token rate into next quarter. That method uses the wrong model, by definition. The elasticity figure from Exponential View’s report says the rate itself is not stable input for a forecast. Usage responds to the rate, and the response outpaces the rate change. A forecast built on price alone will undershoot actual spend whenever a vendor cuts price again.
The token is the wrong meter
Patrick Saner, quoted in the same Exponential View issue, names the reframe directly: “Cost per token is irrelevant. What matters is the cost of completing a useful unit of work.” A token count measures input to a process. It says nothing about the output a business actually needs from that process.
Patrick Saner
Temporal’s “State of Development 2026” survey shows what that gap looks like inside a real engineering organization. The survey, published August 25, 2026, covers 554 engineers in the US and UK. It was fielded between April 29 and May 25, 2026. Three findings from it sit together and explain the problem in full.
79.8% of engineers say token and compute cost is a limiting factor on their work. 80.8% of engineers now use agents daily, up from 47.3% a year earlier. 41.1% hit issues with agents daily or more often.
Read together, those numbers describe one team. The team adopted agents fast. It feels the cost pressure from that adoption. It still fails at the underlying task on a near-daily basis. Agent use nearly doubled in a year. Cost is a stated constraint for four out of five engineers. Four in ten hit a failure at least once a day. Every failed attempt still consumes the tokens spent on it. Token price appears nowhere in that picture. The cost of a finished, working unit of output does.
A company that tracks only token spend sees all three numbers as separate problems. They read as an adoption metric, a cost metric, and a reliability metric. A company that tracks cost per completed task sees one problem instead. The failures are inflating the real price of the work, regardless of what the per-token rate says on an invoice.
The Temporal survey’s own framing supports this reading. It asked engineers directly about cost as a limiting factor, not about the price of a token. Engineers experience cost as a constraint on what they can attempt. It is not a line item they check against a rate card. A survey built around that question captures the same shift in meter that Saner describes. Cost is a property of the work attempted, not of the compute consumed along the way.
What efficient spenders do differently
Ramp’s AI Index was published by Ara Kharazian on August 12, 2026. It measures where AI budgets actually land across real businesses. The report measured AI spend efficiency across businesses. The top 1% by that measure spent a median of $7,400 per employee on AI in July. The median firm across Ramp’s full dataset spent $11.95 per employee in the same month. Ramp reported both figures as stated, and this article presents them the same way, without smoothing the gap between them.
The precise scale of that gap is less important than its direction. Efficient spenders and typical spenders are not different points on the same curve. They behave as two different populations in Ramp’s data. One group appears to measure AI spend against a return. The other appears to spend without that discipline in place, and the bill reflects it.
Ramp’s finding lines up with the elasticity data and the Temporal survey. A business may let usage expand into every available price cut. Without checking the return per job, it ends up in the median group. A business may scope spend deliberately instead. It checks the outcome of each job against its cost, and ends up in the efficient group. The token price a vendor advertises has little to do with which group a company lands in.
The gap is a distribution finding, not a single case study. Ramp reports it as a comparison between the top 1% of businesses and the median business. The comparison describes two distinct approaches to the same spending decision.
Aim narrow, then route
The elasticity data explains why unmanaged AI spend keeps rising. Saner’s reframe names the fix. Almost no company has built a system around that fix yet.
The discipline starts with scope. A company picks a small number of jobs with a clear, provable return. It does this instead of pointing AI at the whole business at once. Every job added past that short list dilutes the return on jobs that already work. Each addition adds a surface where the elasticity effect can run unchecked.
Each chosen job then gets routed to the cheapest model that can complete it to a fixed bar. A model that clears the bar for a support-ticket summary is not required for a contract review. A different model can clear that bar instead. Running every job through the newest, largest model available is the default that produces Ramp’s median outcome. Testing each job against a bar produces one outcome. Assigning the cheapest model that clears it produces Ramp’s top-tier result.
The last piece is measurement. A company tracks the cost of one completed unit of work. Examples include one resolved ticket, one drafted clause, or one qualified lead. Token counts and per-seat license totals cannot answer that question. A completed-unit cost can, and it stays a stable number even as usage grows and the underlying models change.
This is a routing and scoping decision. It is not a model-selection decision made once and left alone. A company may pick one flagship model for every task. It may revisit that choice only when a newer model ships. That company has not made a routing decision at all. It has made a single purchase decision and called it a strategy. The businesses in Ramp’s top 1% are, by the shape of the data, doing something more deliberate than that.
In practice, the discipline runs as a repeatable check, not a one-time audit. A company defines the job and sets a pass bar for output quality. It then tests the cheapest available model against that bar first. If the cheapest model clears the bar, it stays assigned to the job. If it fails, the next tier up gets tested. The process repeats until a model clears the bar. The bar stays fixed. The model assigned to each job can change as new, cheaper options appear. The standard the work has to meet does not change.
That check has to run per job, not once for the whole company. A single company may run a support-ticket job on one model. It may run a sales-research job on a second model, and a contract-drafting job on a third. Each model is chosen for its own job. Applying one model to all three collapses the routing decision into a single purchase decision. That choice reopens the door to the unmanaged growth the elasticity data describes.
This lands differently depending on where you sit
A CFO sees a line item that keeps growing even as unit prices in vendor announcements keep falling. The elasticity data explains why: usage absorbs each discount and adds more on top of it. The needed change is a reporting shift, from tracking token spend to tracking cost per completed unit of work.
A CTO or CIO sees the Temporal numbers as a mandate. Agent adoption nearly doubled in a year, and cost is now a stated constraint for most engineers surveyed. Routing decisions, not blanket model upgrades, are the lever that keeps that adoption affordable at scale.
An engineering leader sees the 41.1% daily failure rate as a hidden cost driver. A failed agent attempt still consumes the tokens spent on it, and a retry adds more. Scoping AI to a small number of well-defined jobs limits the surface where failed attempts run up the bill.
An operations or finance leader sees the Ramp gap as a target, not a curiosity. The top 1% of spenders concentrate spending on a smaller, chosen set of jobs. They check the outcome of each one against its cost, month over month.
Each of these reads the same three data sources and lands on the same underlying fact: token price was never the number to manage.
What does the most repeated unit of work at a company actually cost today, and who is tracking that number?